As previously reported, numbers of excess deaths are rising - but these are not due to Covid. In the week ending 28 April 2023 (Week 17), 12,152 deaths were registered by the Office for National Statistics (ONS) in England and Wales. It is important to remember that these statistics represent people and that 12,152 more people dead in one week should not be something we sweep under the carpet. The number is equivalent to 30 Jumbo Jets crashing a week, and the UK is not alone. Excess mortality rates of over 30% are being recorded in some countries including Iceland, Portugal and Greece.
Possibly the most famous nurse in history, Florence Nightingale following her experiences in the Crimean War wrote her, Notes on Matters Affecting the Health, Efficiency and Hospital Administration of the British Army. In order to better communicate her message she produced a graphical display to show the factual realities of war. The circular graph showed how - and how many people had died during the period from July, 1854, through the end of the following year. It is still generally accepted that this type of graph is best to reveal the big picture.
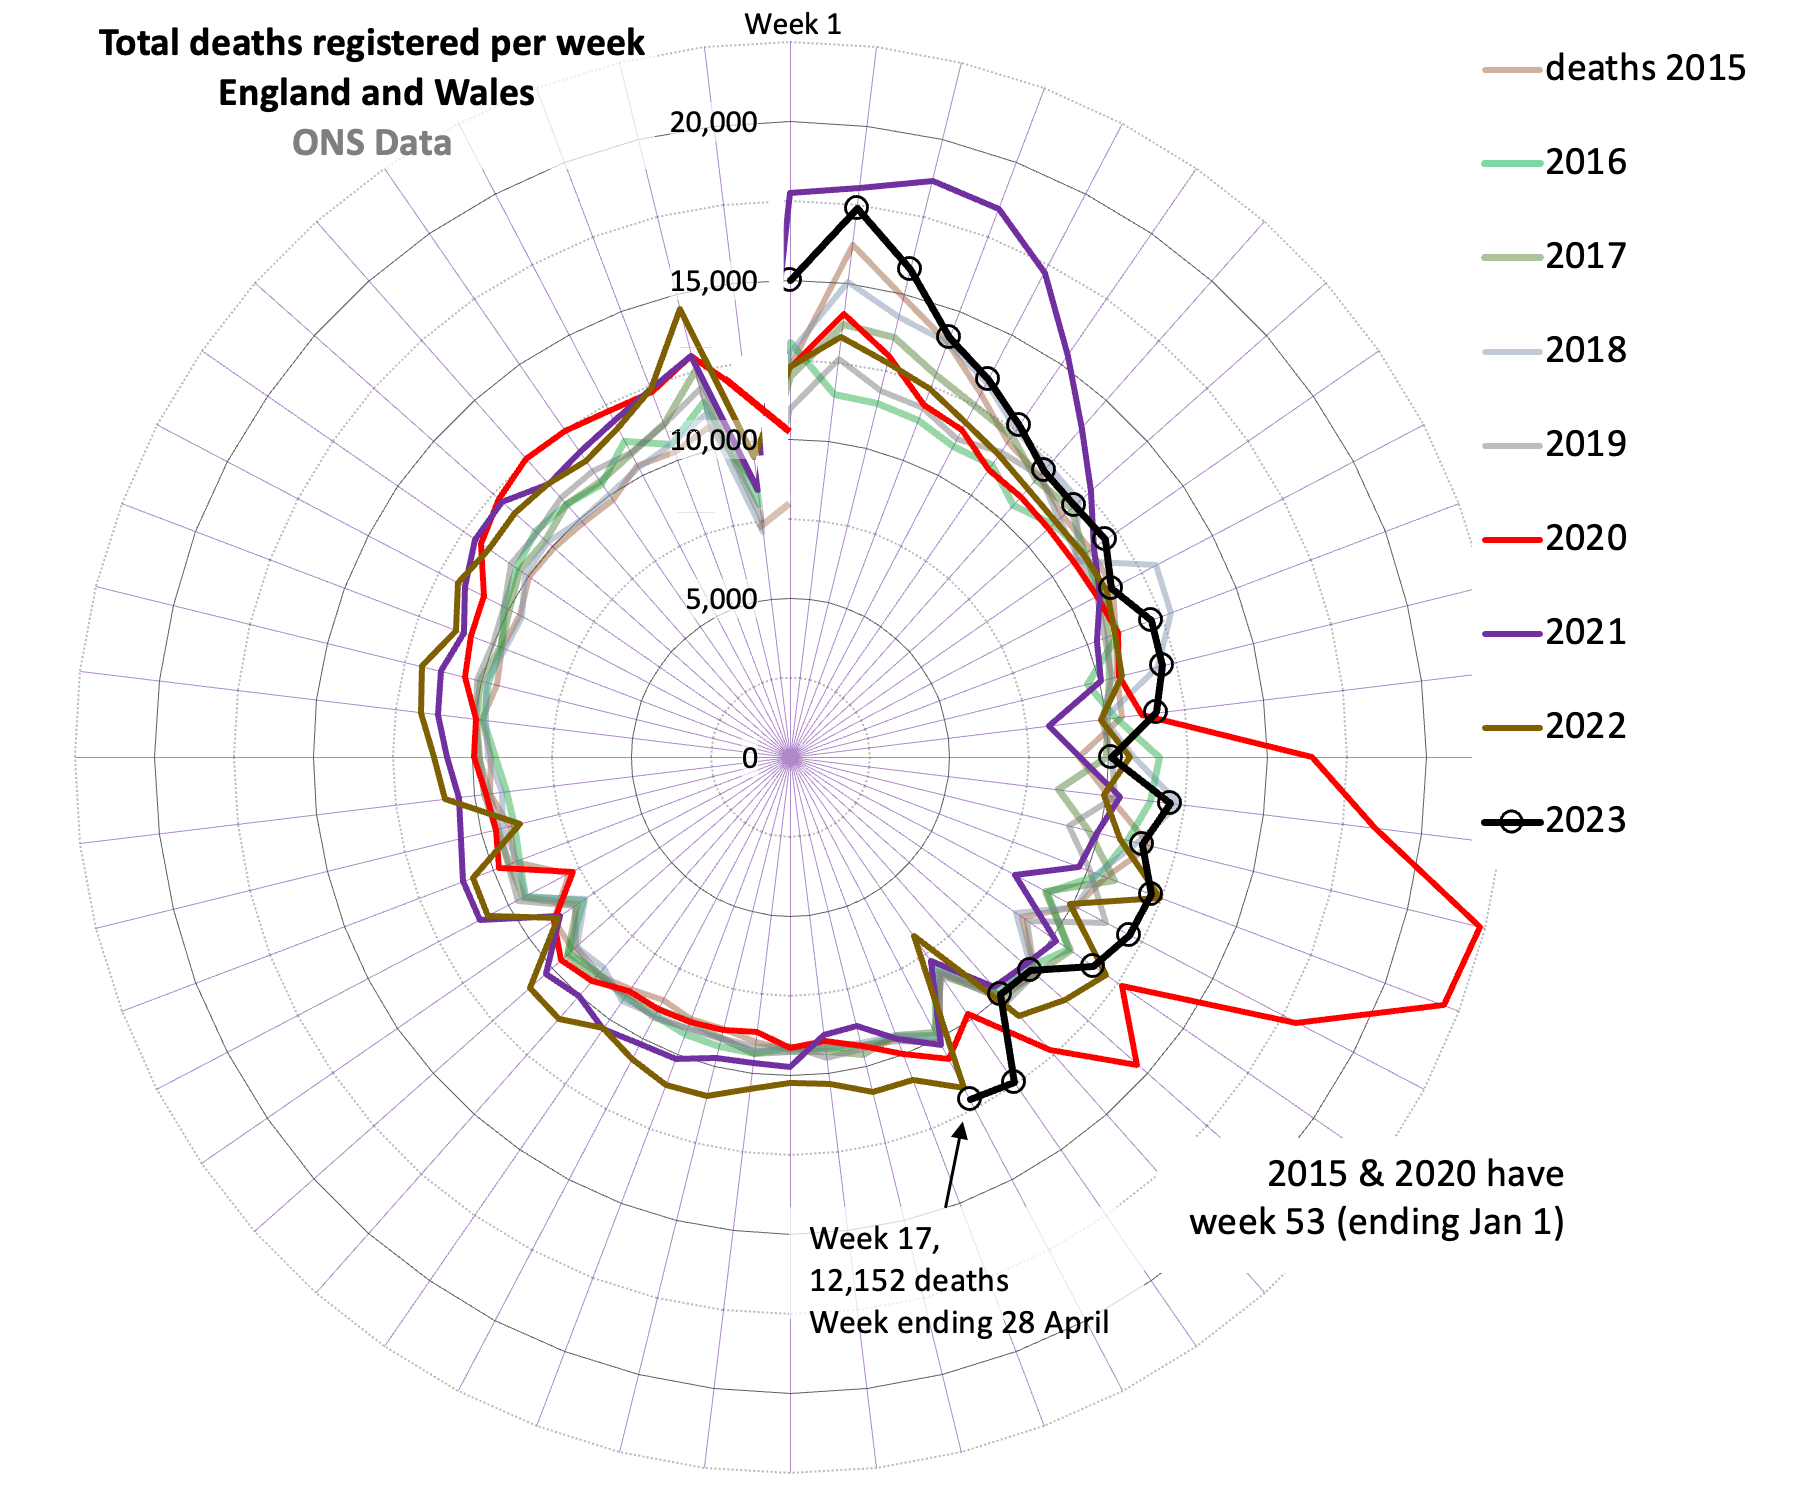 The latest Florence Nightingale Diagram produced by the Oxford Centre for Evidence-based Medicine shows where this week sits in relation to previous years. The ONS report that this week the total number of deaths above the 5-year average is 13.8%.
Where are these deaths happening?
In their Trust the Evidence report, Professors Carl Heneghan and Tom Jefferson say, "Now we’ve had a lot of toing and froing about the best way to measure the excess, but we think a problem with the baseline average can’t fully explain the higher excess in private homes (not nursing homes, people’s own homes)."
They go onto say;
"The number of deaths was 23.3 per cent above the five-year average in private homes (646 excess deaths), 10.7 per cent in hospitals (521 excess deaths), 8.4% in care homes (186 excess deaths) and 14.3% in other settings (117 excess deaths)." Furthermore, "In week 17, 3.8% of the deaths involved covid (459). Of these, 301 deaths (66%) had this recorded as the underlying cause of death. Assuming the data show active cases in which covid played a part, this indicates low-level, constant transmission."
So the largest proportion of deaths are now happening in people's own homes. This trend is a relatively new development and was commented in parliament earlier in the year by Baroness Merron, who as recorded by Hansard said 'the spike in home deaths rings considerable alarm bells. Analysis suggests that record ambulance and emergency delays could be the explanation for a significant number of many more sudden deaths that are occurring at home". Baroness Merron, goes onto ask, "how will the Government know how to overcome this shocking state of affairs?"
Well, it seems like a good question (probably the reason why it was asked!), and one that Florence Nightingale herself is probably interested in finding and answer to. The point of her graph was to try to cut through the military politics in an attempt to show things the way they are. Her aim was to save lives.
It does seem nonetheless that regardless of the lessons from history, the one thing history teaches us is that history doesn't teach us.